Blog
Why Do Rivers Flood?
Rivers flood when the water inflow rate exceeds the normal water discharge rate. The discharge rate is generally measured in KCFS (thousands of cubic feet per second) and is calculated using the river's width, depth, and water velocity.
Generally speaking flood level is considered the point in time when a river begins to overflow its banks. If the water inflow rate remains elevated or increases the flooding will continue to increase until the inflow rate drops below the discharge rate. The point at which a river reaches its maximum stage is called the crest. After cresting some rivers may fall back to their normal levels with 24 - 48 hours while other, usually larger, rivers can take weeks to fall back to normal levels.
Lets take a closer look at the dynamic nature of river flooding to get a better idea about:
What are the main causes of flooding?
Sometimes river flooding isn't the result of a single weather event. There are times when you have a perfect storm of circumstances that come together and in combination with one another result in a flood event. It's often times like this when you see record setting flood events. Here are just a few things that can contribute to a flood:Ground saturation. If the seasonal weather leading up to an event has been particularily rainy then the ground is likely already fairly saturated. The result of this ground saturation is that there's going to be more water runoff into streams and rivers simply because the ground can't hold onto any additional moisture.
Snow melt. If there's a significant amount of snow on the ground preceding a large rain event all of that snow is going to melt. The combination of the rain and snow melt is going to increase the amount of water runoff and possibly exacerbate a flood event. In some cases ice may also be involved and if the ice chunks are large enough they can sometimes pile up and result in a large ice dam that causes the upstream water to get backed up.
Heavy rainfall. Perhaps the most frequent contributor to flooding is a heavy rainfall event. More importantly is the rain fall rate which accounts for time. It takes time for water to run through a river and when the inflow greatly exceeds the outflow you get a rapidly rising water level which sometimes gets classified as a flash flood. Most rivers could manage days and days of rain without flooding so long as the rainfall is spread out over time. If a river is hit with several inches of water in a matter of hours there's just no river that can drain that fast and some level of flooding is bound to happen. This most often happens when a hurricane or a stalled out weather front sits over an area with intense precipitation rates.
Consecutive rainfall events. In some circumstances you can get multiple weather fronts coming to an area one after another. If the first weather front hits with a lot of rainfall that could result in a river's water level to be at an elevated state by the time the second weather front comes in. This makes reaching a river's flood stage much more likely.
Urban development. When buildings, parking lots, streets and sidewalks get developed they all have one thing in common. They reduce the amount of exposed ground and contribute to water runoff. Poor urban planning could result in all that water being routed directly to streams and/or rivers. The accelerated water drainage compounds the water inflow rate which increases the chance of flood events.
How are floods forecasted?
Flood forecasting is data driven. The data that's used can largely be broken out into four parts or steps all of which help create an overall picture of how a river will react to a rain event. Like any weather related forecast flood forecasts aren't always right but they at the very least give people some idea on what to expect and in some cases help save property and lives.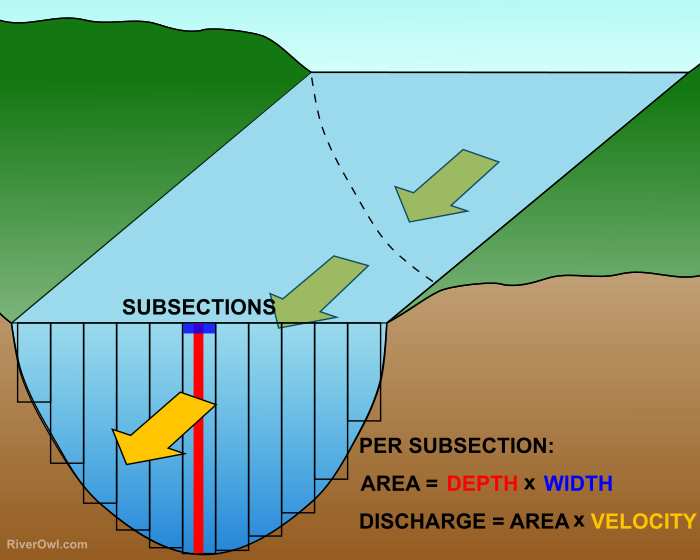
1. Measuring stream stage is one of the key components to providing flood forecasts. The stream stage, sometimes called gauge height, is simply the measurement of the height/depth of the water from the surface to the bottom. One common method to taking this measurement is with a stilling well. Water from the river enters and leaves the stilling well through underwater pipes, which allows the water in the stilling well to be at the exact same elevation as the water in the river. The stage is then measured inside the stilling well using a float or a pressure, optic, or acoustic sensor. When stilling well isn't cost effective measuring the pressure required to maintain a small flow of gas through a tube and bubbled out at a fixed location under water in the stream. The amount of pressure required is directly related to the amount of overhead water. The deeper the water the more pressure is required.
2. Measuring discharge is a second key component. The discharge is simply the rate at which the water is flowing past a location. The faster the water flows the higher the discharge rate. Conversely the slow the water flows the lower the discharge rate. Generally speaking narrow rivers flow faster and wide rivers flow slower. Bends in the river can also affect speed. Water flowing on the outside of the bend flows faster than the water on the inside of the bend.
To measure the rate of speed the USGS uses an Acoustic Doppler Current Profiler (ADCP). The ADCP uses the Doppler Effect to determine the rate of speed by sending a sound pulse down into the water and measuring the change in frequency of the sound pulse being reflected back. It's the change in frequency, or Doppler Shift, that's translated into the rate of speed.
Since stream stage and discharge rates can vary widely from bank to bank these measurements are often taken over 25 to 30 evenly spaced subsections. This way they can take into account the variability of the river and get a complete picture of how it functions at different stages.
3. Plotting the stage to discharge relationships is the third part to providing a forecast. Once the USGS has compiled enough data points across varying flood stages they can plot the stage-discharge relationship (also called rating). Obtaining an accurate stage-discharge relation requires numerous discharge measurements at all ranges of stage and stream flow due to the fact that it's a non-linear relationship. These measurements have to be taken at each river because the stage-discharge relation is affected by the shape, size, slope, and roughness of the river, all which can vary considerably.
4. The fourth component is factoring in the rain forecast. Knowing how much rain is going to fall into a river plain will allow forecasters to reference impacts from previous rainfall events. Taking all data into consideration a river forecast emerges. In the event the rainfall forecast changes you can likely expect the river forecast to change as well. This is likely the largest variable in a river forecast because the path a severe weather system takes could have a significant impact on exactly how much water enters the river. Just a few miles in either direction could make a huge difference.
How does river flooding change over time?
You might think that a river's response to rainfall events are always going to be the same. The rivers that divide The reality is that the river is constantly changing. There's always erosion and deposition of riverbed materials, seasonal vegetation growth, debris and ice. All of these things can play a role in the variability of a river's response to rainfall events. As a result of this the USGS has to continually sample and analyze the stage and discharge data to look for any changes. As the river changes over time the flood forecast model needs to be updated as well.In addition to natural events reshaping the water flow in a river there can be some man made events that impact water flow as well. Dams, drainage ponds, fish weirs and urban development in general can also impact water levels and the flow of water over time. In the case of rivers that are used a primary modes of transportation dredging can also come into play.
Our final thoughts.
If you live anywhere near a river then the river forecast is just an extension of the weather forecast. Being attentive to the impact weather events will have on the rivers near you will help you be prepared for what lies ahead. During flood events be sure to tune into your local weather service for the most up-to-date weather information. The best time to get out of harms way is before the flooding starts. It only takes 6" of swiftly moving water to knock someone off their feet and only 12" to sweep away most cars. Turn Around Don't DrownNever miss a new post. Subscribe via email today and receive site updates.
| Email |
By clicking Subscribe, you agree that you've read and accepted our Terms of Service and you consent to our Privacy Policy. |